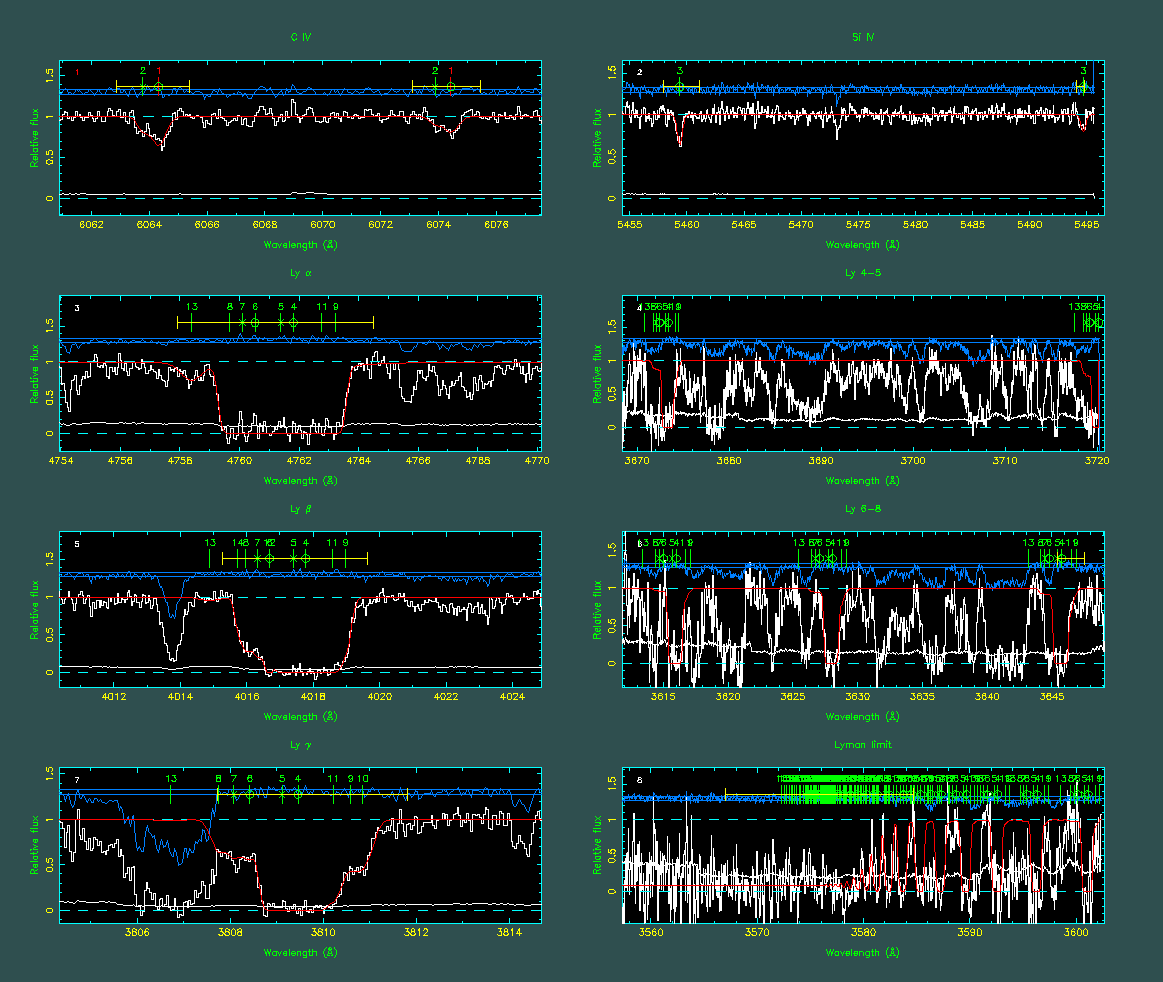
Here is a real-life example of an absorption system that was fit with
vpguess/VPFIT. The white histograms show the data. The
different panels each show a different data chunk, each of which
covers a different ion or transition. These are indicated above the
panels. The smooth red line is the fitted model of the system. The
positions of the individual absorption lines are indicated by the tick
marks above the spectra. The crosses and circles on some of the tick
marks indicate "tied" parameters. The white lines near zero flux are
the error arrays and the blue lines above the spectra show the
residuals of the fit. The straight yellow lines above the spectra mark
the spectral regions that were included in the fit. Finally, the zero
flux and continuum levels are indicated by the cyan dashed lines (in
this case the spectra were already normalised, so the continuum level
is 1 everywhere).